A Field Guide to E-Commerce Conversion Optimization and Store Economics
Understanding Store Economics and Benchmark Metrics

E commerce conversion optimization is the disciplined practice of turning more existing store visitors into buyers by streamlining navigation, improving product page persuasion, eliminating checkout friction, and running structured A/B tests. When we evaluate digital storefronts, we look past surface-level traffic vanity metrics. A million visitors mean very little if your unit economics leak capital at every stage of the funnel. To build a resilient brand, you must understand how macro-conversions (completed purchases) and micro-conversions (email signups, adding items to a wishlist, or viewing size charts) interact with your customer acquisition cost (CAC).
Across global retail in 2026, the average ecommerce conversion rate sits near 2.2% to 2.86%. Top-tier operators routinely exceed 4.5% by systematically removing friction from their buyer journeys. Understanding where your store stands requires segmenting performance by device and industry category.
| Industry Vertical | Average Conversion Rate | Top 10% Performers | Desktop Benchmark | Mobile Benchmark |
|---|---|---|---|---|
| Beauty & Skincare | 5.74% – 9.70% | 10.50%+ | 6.20% | 4.80% |
| Electronics & Accessories | 2.50% – 9.50% | 11.00%+ | 4.10% | 2.60% |
| Food & Beverage | 6.02% | 8.50%+ | 6.80% | 5.40% |
| Apparel & Fashion | 2.50% – 3.41% | 5.80%+ | 3.50% | 2.10% |
| Home & Garden | 2.20% – 3.80% | 6.20%+ | 3.80% | 2.20% |
| Luxury Goods | 0.95% | 2.40%+ | 1.40% | 0.70% |
Understanding these conversion rate optimization benchmarks allows brands to diagnose structural deficits rather than guessing where performance lags.
Calculating Conversion Rates and Drop-Off Points
Calculating your baseline conversion rate is straightforward: divide total transactions by total unique sessions and multiply by 100.
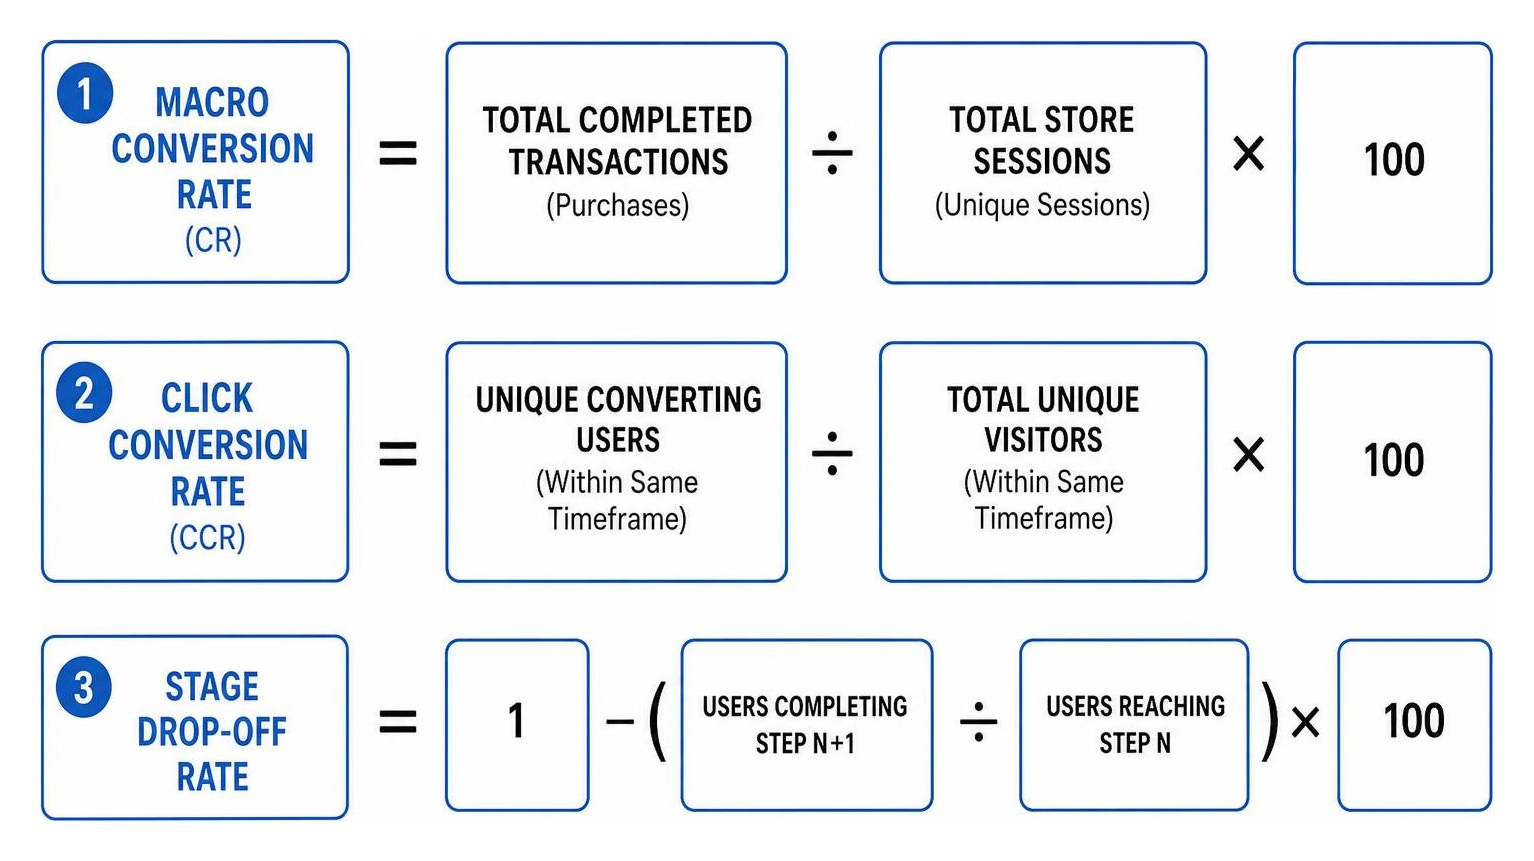
To diagnose funnel leakage with true precision, we rely on three distinct formulas:
- Standard Conversion Rate: $(\text{Total Completed Transactions} \div \text{Total Store Sessions}) \times 100$
- Click Conversion Rate (CCR): $(\text{Unique Converting Users} \div \text{Total Unique Visitors}) \times 100$ (isolates repeat buyers within identical timeframes)
- Stage Drop-Off Rate: $1 - (\text{Users Completing Step } N+1 \div \text{Users Reaching Step } N) \times 100$
Measuring micro-conversion progression through each stage highlights exact operational bottlenecks. If 70% of visitors browse a product detail page (PDP), but only 6% initiate an add-to-cart action, the product page fails to build purchasing confidence. If 60% add to cart, but only 20% complete checkout, your checkout experience introduces unnecessary purchase friction.
Aligning Store Economics with E Commerce Conversion Optimization
Store profitability relies on the interplay between conversion rate, Average Order Value (AOV), Customer Lifetime Value (LTV), and paid acquisition efficiency. A 1% lift in your conversion rate does not merely yield a linear sales increase; it fundamentally shifts your contribution margin.
When you master e commerce conversion optimization, your existing traffic delivers higher yields, lowering your effective CAC. For modern direct to consumer brands, this extra efficiency expands allowable marketing bids, letting you outcompete rivals on high-intent search terms while protecting net margins.
The Strategic Pillars of E Commerce Conversion Optimization
High-performing storefronts do not rely on visual flair alone. They rely on an intuitive architecture that guides shoppers seamlessly from discovery to purchase.
Executing a complete ecommerce CRO framework requires harmonizing technical performance, user experience design, and psychological trust signals across your catalog.
Streamlining Navigation and Search Discovery
On-site searchers are among your most valuable visitors; they convert 2 to 3 times higher than casual browsers because they arrive with explicit purchase intent. Capitalizing on that intent demands an intuitive information architecture:
- Intelligent Autocomplete: Deliver real-time query suggestions featuring thumbnail imagery, current pricing, and inventory availability directly in the search overlay.
- Faceted Filtering: Let shoppers filter products dynamically by size, color, material, use case, and customer ratings without triggering full page reloads.
- Resilient Zero-Result Handling: When a specific keyword yields zero direct matches, avoid dead ends. Offer smart spell-correction, related categories, and top-selling alternatives.
Optimizing Product Pages for Persuasion
The product page serves as your digital sales floor. Shoppers cannot pick up, touch, or try on your catalog items, so your digital assets must bridge the sensory gap.
The product page is often the highest-leverage touchpoint on your site:
- Visual Asset Hierarchy: Feature at least 6 high-resolution product photographs, contextual lifestyle shots, 360-degree interactive viewers, and short video demonstrations. Highlighting video content on core landing areas can improve conversion rates by 80% or more.
- Outcome-Focused Copy: Replace basic feature lists with benefit-driven messaging that answers customer questions and overcomes objections before they arise.
- Prominent Above-the-Fold CTAs: Keep your primary add-to-cart button distinctly colored, prominently sized, and placed alongside critical shipping and stock status cues.
- Authentic Scarcity and Urgency: Display real-time inventory counts ("Only 3 left in stock") and dynamic order cut-off timers for express delivery. Avoid manipulative countdown timers that reset on refresh; shoppers spot artificial urgency quickly, which erodes trust.
Building Trust with Social Proof and UGC
Trust is the foundation of digital commerce. Approximately 98% of shoppers read authentic reviews before completing an order, and displaying customer feedback can lift overall conversions by up to 270% (and up to 380% for premium, higher-priced items).
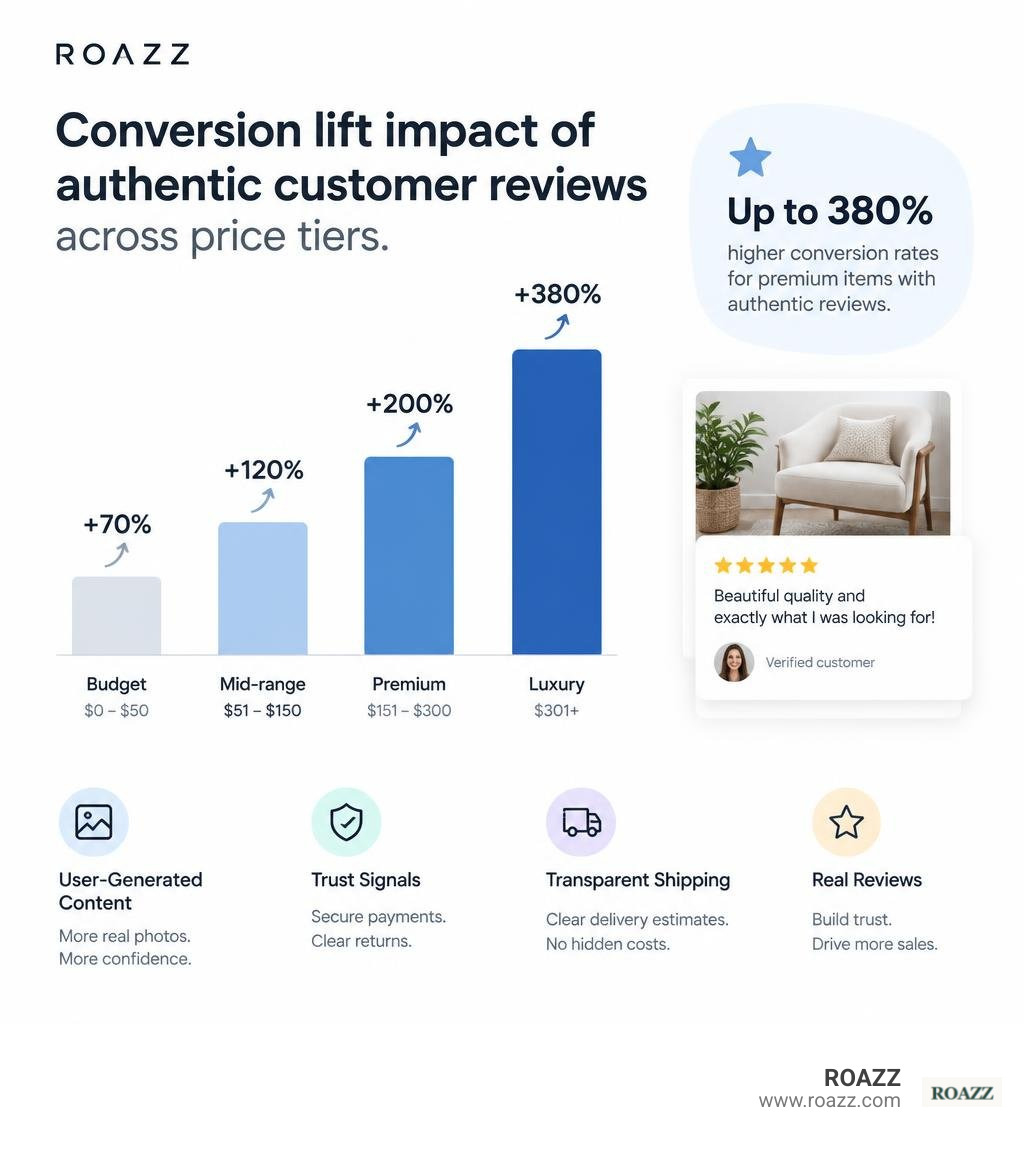
To maximize buyer trust:
- User-Generated Content (UGC): Integrate customer photo galleries and unboxing videos directly into product pages. Stores featuring rich visual UGC experience up to a 90% increase in on-site dwell time.
- Contextual Trust Signals: Position payment security certifications, clear return warranties, and customer support links right beside your primary purchase buttons.
- Transparent Shipping Policies: Place clear delivery estimates and return details in your site header, footer, and near the add-to-cart button. Hidden costs remain the leading driver of shopping cart abandonment worldwide.
Eliminating Friction Across Checkout and Mobile Experiences

According to research from the Baymard Institute, cart abandonment rates currently hover between 69% and 70% across the global ecommerce landscape. Nearly 18% of shoppers abandon orders entirely due to checkout usability issues and form friction. Every additional form field, confusing step, or unexpected cost chips away at your revenue.
Slashing Cart Abandonment and Form Friction
Designing an efficient checkout requires removing unnecessary barriers. Adopting evidence-based checkout strategies helps recover otherwise lost purchasing intent:
- Mandatory Guest Checkout: Approximately 18% of US shoppers abandon carts when forced to create an account before buying. Let visitors complete orders as guests first, then offer single-click account creation on the final confirmation page.
- Address Autocomplete and Validation: Use predictive address lookups to minimize typing errors, shorten checkout times, and prevent delivery exceptions.
- Field Subtraction: The average digital checkout presents 11.8 form fields, well above the optimal 8. Eliminate redundant address lines, combine first and last name fields where possible, and clearly label optional details.
- Collapsible Promotional Fields: Visible, empty coupon input boxes prompt shoppers to leave your checkout in search of discount codes. Tuck promotional fields behind an unobtrusive text link ("Have a promo code?") to keep buyers focused on completing their order.
Designing Mobile-First Shopping Experiences
Mobile devices generate over 60% of all ecommerce traffic, yet mobile conversion rates (2.8%) consistently trail desktop benchmarks (3.2%). Closing this revenue gap requires true mobile-first interface engineering:
- Thumb-Zone Architecture: Place primary actions—such as navigation menus, filter toggles, and add-to-cart buttons—within easy reach of a shopper's thumb.
- Sticky Add-to-Cart Bars: Keep a slim add-to-cart bar pinned to the bottom of mobile screens as users scroll through long product pages. This simple enhancement can lift mobile add-to-cart rates by 8% to 20%.
- Sub-Second Load Times: Page performance directly drives sales velocity. A 0.1-second improvement in mobile loading speed yields an 8.4% conversion lift for retail storefronts. Every second of delay above 2 seconds reduces conversions by roughly 7%.
Next-Generation Levers: Payment Innovation and Dynamic Personalization
Modern conversion optimization extends well beyond static page layouts. Brands now deploy dynamic personalization and advanced checkout integrations to tailor shopping experiences in real time.
Reviewing how our methodology works reveals how aligning technical checkout systems with intent-driven traffic sources unlocks sustainable growth.
Modern Payment Architecture and Agentic Commerce
Payment diversity is essential for conversion optimization. Offering modern digital wallets—such as Apple Pay, Google Pay, and Stripe Link—delivers a 7%+ conversion lift for returning, logged-in shoppers by removing manual credit card entry.
Integrating Buy Now, Pay Later (BNPL) providers like Affirm, Klarna, or Afterpay can increase overall store revenue by up to 14%, lifting both conversion rates and Average Order Value on purchases above $75.
Looking ahead, agentic commerce is emerging as an exciting optimization frontier. As autonomous AI agents begin researching and purchasing products on behalf of consumers, supporting open machine-readable product data, structured schema markups, and instant agentic checkout protocols will ensure your catalog remains easily discoverable and purchasable by automated buyers.
Tailoring Experiences with Dynamic Personalization
Over 71% of modern consumers expect personalized shopping experiences, and 76% express frustration when sites fail to deliver them. Fast-growing brands generate roughly 40% more revenue from personalization than their slower-moving peers:
- AI-Driven Recommendation Carousels: Replace generic "You Might Also Like" modules with dynamic recommendation engines that reflect a visitor's real-time browsing path, past orders, and current cart items.
- Dynamic Landing Pages: Match incoming ad messaging directly to landing page copy and imagery, creating a cohesive experience that builds buying confidence.
- Automated Cart Recovery Sequences: Complement on-site experiences with automated, dynamic email and SMS cart recovery sequences sent within 1 to 4 hours of abandonment, recovering 10% to 15% of lost checkouts.
Building a High-Velocity Experimentation Framework
Consistent conversion optimization is a disciplined operational process, not a one-time project. High-performing ecommerce organizations build structured testing programs that evaluate new concepts, analyze user behavior, and iterate rapidly based on measurable outcomes.
Using structured ecommerce testing playbooks helps teams maintain testing velocity while avoiding common statistical pitfalls.
| Prioritization Metric | ICE Framework | PIE Framework | Best Use Case |
|---|---|---|---|
| Criterion 1 | Impact: Potential business lift | Potential: Improvement headroom | Fast-paced agile marketing teams |
| Criterion 2 | Confidence: Certainty backed by data | Importance: Traffic volume & value | Complex, high-traffic catalogs |
| Criterion 3 | Ease: Implementation complexity | Ease: Engineering & design effort | Resource-constrained developers |
| Scoring Scale | 1 to 10 per category (Average) | 1 to 10 per category (Average) | Quantitative backlog ranking |
Explore our dedicated performance marketing services to see how we pair deep user research with rigorous experimentation frameworks to accelerate store growth.
Formulating Hypotheses and Prioritizing Backlogs
Every meaningful test begins with a strong hypothesis grounded in qualitative and quantitative research:
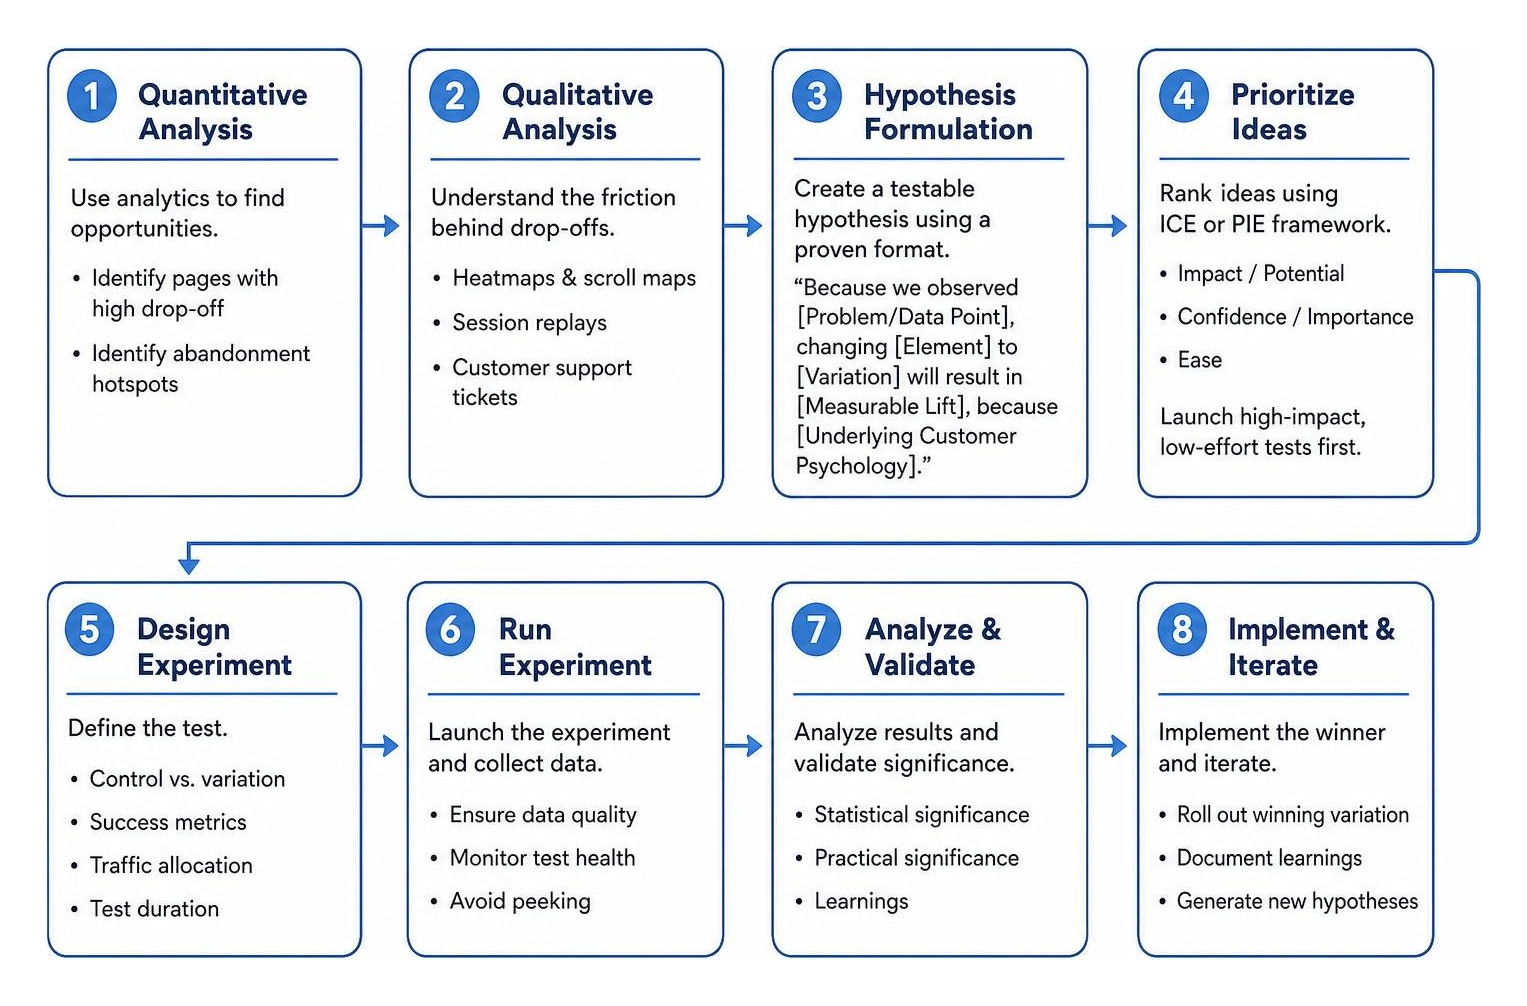
- Quantitative Analysis: Use tools like Google Analytics 4 to identify pages with high drop-off and abandonment rates.
- Qualitative Analysis: Use heatmaps, scroll maps, session replays, and customer support tickets to uncover the UX friction behind those drop-offs.
- Hypothesis Formulation: Use a proven format: "Because we observed [Problem/Data Point], changing [Element] to [Variation] will result in [Measurable Lift], because [Underlying Customer Psychology]."
- Prioritization: Score ideas using the ICE or PIE framework to ensure high-impact, low-effort optimizations launch first.
Measuring Long-Term ROI in E Commerce Conversion Optimization
To draw dependable conclusions, run every A/B test for at least two full business cycles (typically 14 to 28 days) until your analytics reach a minimum of 95% statistical significance. Ending tests prematurely creates false positives caused by day-of-week purchase variations or temporary traffic spikes.
Document every outcome systematically—including tests that do not show positive results. Neutral and losing tests often surface critical insights about your audience, preventing expensive engineering mistakes down the line and contributing to compounding gains across your entire product catalog.
Brands looking for a structured, month-by-month framework can follow a complete CRO roadmap to systematically scale their testing velocity.
Frequently Asked Questions About Conversion Optimization
For additional operational questions and strategic best practices, explore our comprehensive FAQs.
What is considered a good ecommerce conversion rate in 2026?
A global ecommerce conversion rate between 2.2% and 3.0% is considered standard across broad retail. Top-performing brands regularly achieve 4.5% to 9.5%, depending on their product category, average price points, and traffic channels. Beauty and skincare brands often see average conversion rates around 5.7% to 9.7%, while luxury goods convert closer to 0.95% due to longer research cycles and higher purchase amounts.
What are the biggest drivers of shopping cart abandonment?
The primary drivers of cart abandonment include unexpected shipping fees and taxes revealed late in checkout (accounting for roughly 48% of drop-offs), forced account creation (causing 18% of abandonments), overly complicated multi-step forms, limited payment options, and general concerns regarding payment security.
How long should an ecommerce A/B test run before declaring a winner?
An ecommerce A/B test should run for at least two complete business cycles (a minimum of 14 days) to capture differences in weekday versus weekend shopping habits. It must also record several hundred conversions per variant and achieve at least 95% statistical significance before you push winning changes to production.
Conclusion
Lifting your online store's conversion rate requires a continuous, disciplined approach across technical performance, site navigation, product page design, checkout simplicity, and payment flexibility.
By grounding your optimization strategy in solid store economics and prioritizing changes with real testing data, you can build a reliable digital storefront that converts valuable traffic into long-term customer revenue. Explore how ROAZZ helps brands turn traffic into measurable sales and sustainable growth.